

Are you curious about how well your landing page is really performing? Knowing the right landing page stats can make all the difference in turning visitors into customers.
When you understand these numbers, you can spot what’s working and fix what’s not—fast. This means more clicks, more sign-ups, and more sales for your business. Keep reading to discover the key stats you should track and how they can help you boost your results right away.
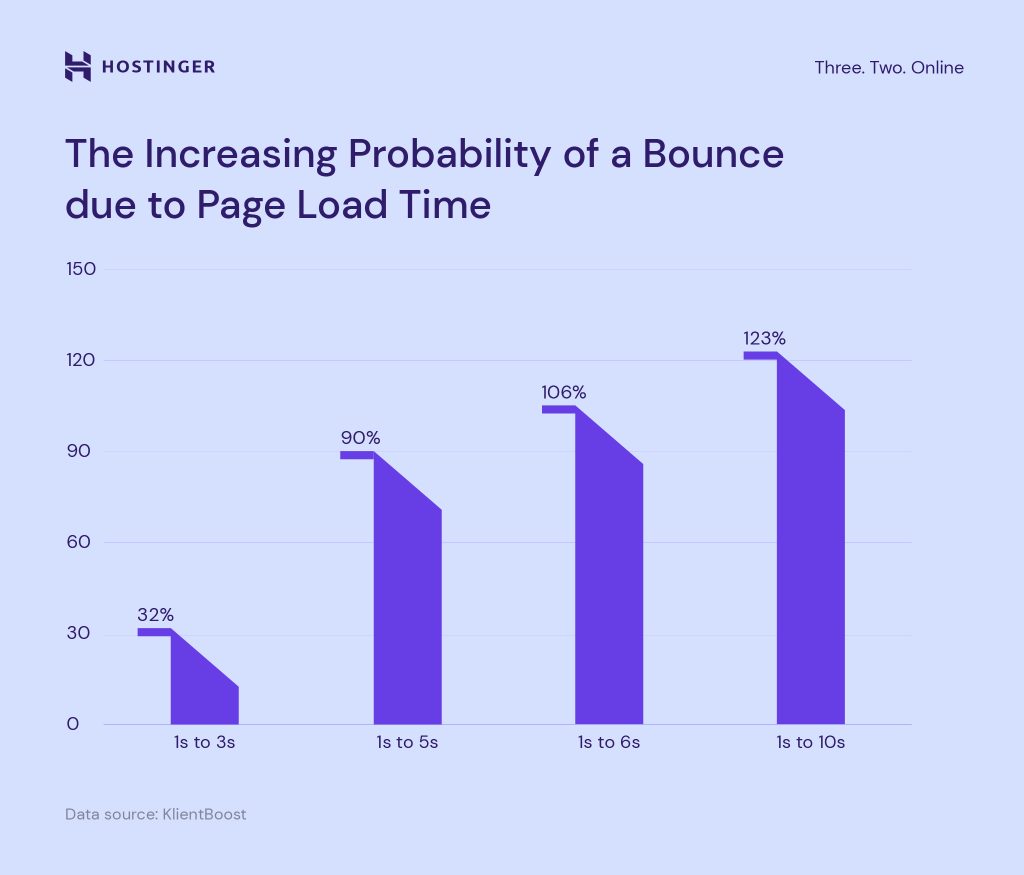
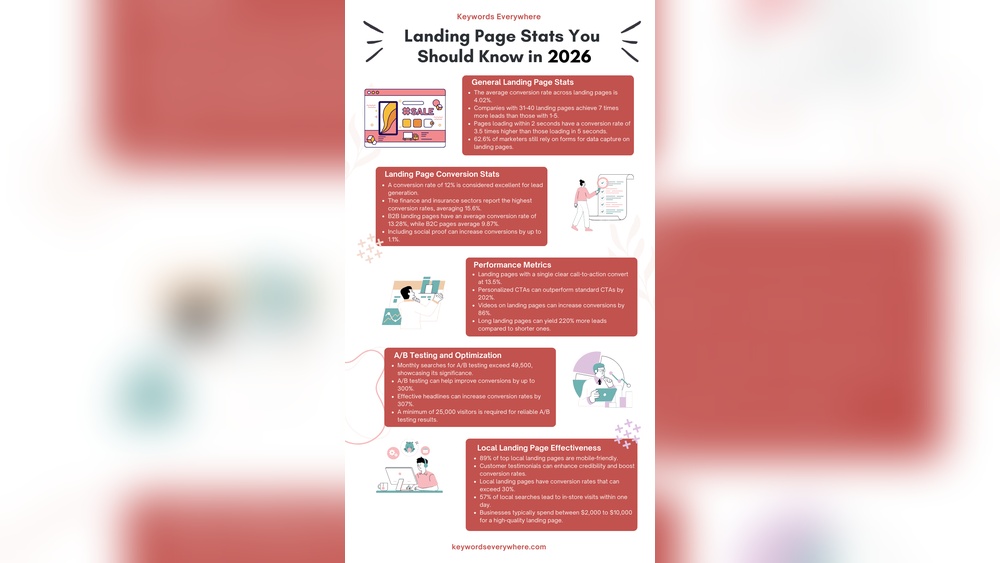
Credit: www.hostinger.com
Key Metrics To Track
Tracking the right metrics helps improve your landing page’s success. These numbers show how visitors behave and react. You can spot what works and what needs fixing. Focus on these key metrics to get clear insights.
Conversion Rate
Conversion rate shows the percentage of visitors who complete a goal. This could be signing up, buying, or downloading. A high conversion rate means your page meets visitor needs well. Check this metric often to see if changes help.
Bounce Rate
Bounce rate measures visitors who leave after one page view. A high bounce rate means visitors don’t find what they want. It can signal slow loading, confusing design, or weak content. Lower bounce rate keeps visitors exploring your site longer.
Average Time On Page
Average time on page tells how long visitors stay. Longer time means they find the content useful or interesting. Short time means visitors lose interest quickly. Use this data to improve content quality and engagement.
Click-through Rate
Click-through rate (CTR) tracks how many click links or buttons. It shows how well calls-to-action attract visitors. A low CTR suggests you need clearer or stronger prompts. A high CTR means visitors want to learn more or take action.
Design Elements That Impact Conversions
Design plays a big role in how many visitors turn into customers. Small changes in design can lead to big changes in conversion rates. Each element on a landing page guides visitors toward taking action. Understanding which parts affect conversions helps create better pages.
Headline And Copy
The headline is the first thing visitors see. It must be clear and grab attention fast. Good headlines explain the offer simply. The copy should support the headline. Use short sentences and simple words. Focus on benefits, not features. Clear text helps visitors understand the value quickly.
Call-to-action Placement
Calls to action (CTAs) tell visitors what to do next. Place CTAs where they are easy to spot. Above the fold is a good spot. Use contrasting colors to make buttons stand out. Repeat CTAs for longer pages. Clear and visible CTAs increase the chances of clicks.
Visuals And Media
Images and videos can explain offers better than text. Use high-quality visuals that relate to the message. Avoid clutter or too many images. Simple, relevant visuals keep visitors focused. Videos should be short and clear. Proper media can build trust and interest.
Page Load Speed
Slow pages make visitors leave fast. Every second counts. Optimize images and reduce scripts to load faster. Use tools to test speed regularly. Fast pages keep visitors engaged and ready to act. Speed is a key factor in conversions.
Audience Behavior Insights
Understanding how visitors behave on your landing page helps improve its performance. Audience behavior insights reveal how users interact with your content. These insights guide changes to increase engagement and conversions.
Studying user actions uncovers patterns and preferences. This data lets you tailor your page to meet visitor needs better. Tracking audience behavior is a vital step in optimizing your landing page.
Device Usage Patterns
Knowing which devices visitors use helps design better pages. Mobile phones, tablets, and desktops show different behaviors. Most users now visit sites on mobile devices.
Check how many visitors use smartphones versus desktops. Adjust your page layout to suit the most common devices. Fast loading and easy navigation matter most on mobile.
Traffic Sources
Visitors come from search engines, social media, or ads. Each source brings different types of users. Analyzing traffic sources shows which channels work best.
Focus on sources that bring engaged visitors. Use this data to invest in the best marketing channels. Ignore sources with low-quality traffic.
User Journey Analysis
Track steps visitors take from arrival to conversion. See which pages they visit and where they leave. This helps find obstacles in the user path.
Improve the journey by removing barriers and simplifying navigation. Clear calls to action guide users toward your goal. A smooth journey raises conversion rates.
A/b Testing Strategies
A/B testing is a key method to improve landing page performance. It helps identify what works best for visitors. By testing different versions, you can increase conversions and reduce bounce rates. Careful planning and analysis make A/B testing effective.
Choosing Variables To Test
Pick one element to test at a time. It could be a headline, button color, or image. Focus on parts that affect user action. Avoid testing too many things together. This keeps results clear and easy to understand.
Interpreting Results
Look at data like click rates and conversions. Compare these numbers between versions A and B. Check if differences are big enough to matter. Use statistical tools to confirm results. Don’t rush to conclusions with small changes.
Implementing Changes
Apply the winning version to your landing page. Monitor its performance over time. Keep testing new ideas regularly. Small improvements add up to better results. Stay patient and consistent for lasting success.
Tools For Monitoring Landing Page Performance
Monitoring landing page performance is essential for improving user experience and boosting conversions. Using the right tools helps track visitor behavior, understand what works, and spot areas for improvement. These tools provide data that guides smart decisions to make landing pages more effective.
Analytics Platforms
Analytics platforms show how many people visit your landing page. They track where visitors come from and what actions they take. Google Analytics is a popular choice for this. It provides data on page views, bounce rate, and user demographics. This information helps identify which parts of your page attract attention and which need change.
Heatmaps And Session Recordings
Heatmaps reveal where visitors click or tap on your page. They use colors to show popular areas and ignored spots. Session recordings play back real visitor actions. Watching these sessions helps understand how users navigate your page. Both tools show if visitors get stuck or leave too soon.
Conversion Funnels
Conversion funnels track the steps visitors take before completing a goal. They show where users drop off during the process. This helps find obstacles that stop conversions. By fixing these issues, more visitors can finish actions like signing up or buying. Funnels give a clear picture of user flow and success points.
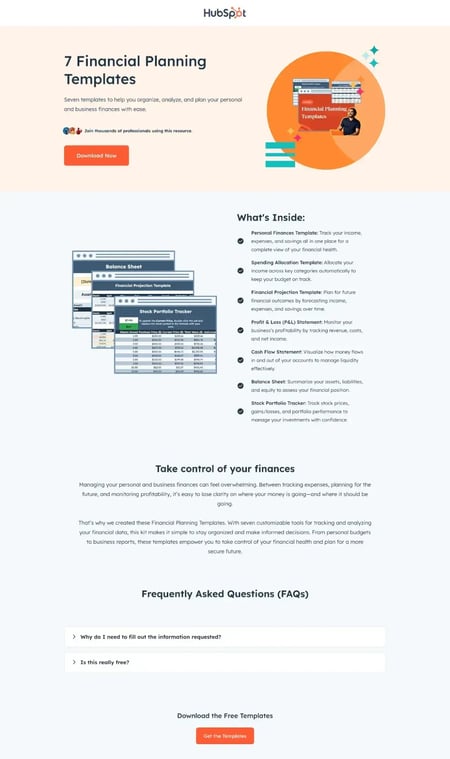
Credit: blog.hubspot.com
Common Conversion Barriers
Many landing pages lose visitors before they convert. This happens because of common barriers that stop users from completing actions. Understanding these barriers helps improve conversion rates. Simple changes can make a big difference.
Form Length And Complexity
Long forms scare visitors away. Asking for too much information makes users quit. Short forms with only essential fields work best. Clear labels and easy questions reduce confusion. Users prefer quick and simple sign-ups.
Trust Signals
People want to feel safe before sharing data. Missing trust signals cause doubt and hesitation. Adding security badges and customer reviews builds confidence. Clear privacy policies reassure visitors about their data. Trust signals increase the chance of conversion.
Mobile Optimization Issues
Many users visit landing pages on phones. Pages that don’t work well on mobile lose visitors fast. Slow loading, hard-to-read text, and small buttons frustrate users. Mobile-friendly design improves user experience and conversions. Responsive layouts fit all screen sizes perfectly.
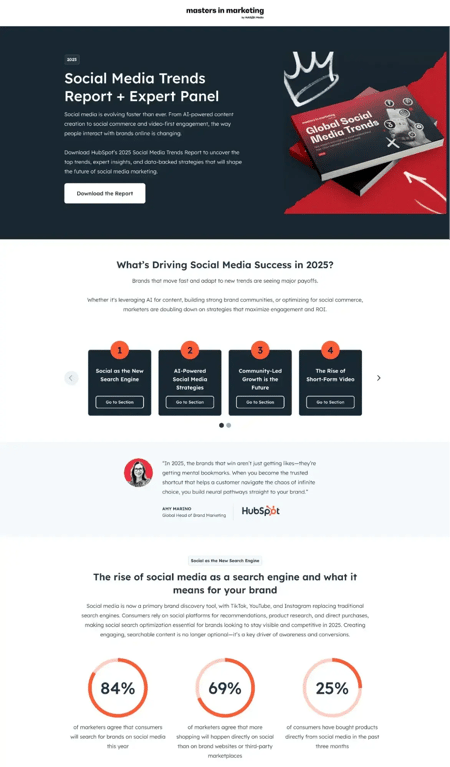
Credit: blog.hubspot.com
Frequently Asked Questions
What Are The Key Landing Page Statistics To Track?
Track metrics like conversion rate, bounce rate, average session duration, and traffic sources. These stats reveal user engagement and page effectiveness. Monitoring these helps optimize landing pages for better performance and higher conversions.
How Does Landing Page Speed Affect Conversion Rates?
Faster landing pages improve user experience and reduce bounce rates. Studies show a 1-second delay can drop conversions by 7%. Optimizing page speed is crucial for retaining visitors and increasing conversion opportunities.
What Is The Average Conversion Rate For Landing Pages?
The average landing page conversion rate varies by industry but typically ranges from 2% to 5%. High-performing pages can exceed 10%. Understanding this benchmark helps set realistic goals and measure campaign success.
Why Is Bounce Rate Important For Landing Pages?
Bounce rate indicates the percentage of visitors leaving without interaction. A high bounce rate suggests irrelevant content or poor design. Lower bounce rates usually correlate with better engagement and higher chances of conversion.
Conclusion
Landing page stats show how visitors interact with your site. They help you see what works and what does not. Use this data to improve your page design and content. Small changes can lead to better results. Keep testing different ideas and track the numbers.
This way, you can create pages that attract and keep visitors. Understanding these stats is key to growing your online presence. Focus on clear goals and measure progress often. Success comes from learning and adjusting your strategy.