Are you curious about how the SaaS industry is changing the way businesses operate? Understanding SaaS statistics can give you a clear edge, whether you’re running a company, planning to launch software, or simply want to stay ahead in the tech game.
These numbers reveal powerful trends, growth opportunities, and challenges that could impact your decisions. Keep reading to discover the key SaaS facts that matter most to you and learn how to use this knowledge to boost your success.

Credit: www.appvizer.com
Saas Market Growth Trends
The Software as a Service (SaaS) market has seen rapid growth in recent years. Many businesses now use SaaS tools to improve work efficiency and cut costs. This trend shows no signs of slowing down. Understanding SaaS market growth helps companies plan their strategies well.
Here, we explore important trends shaping the SaaS industry. These include the market size, key factors driving growth, and emerging regions to watch.
Global Market Size And Forecast
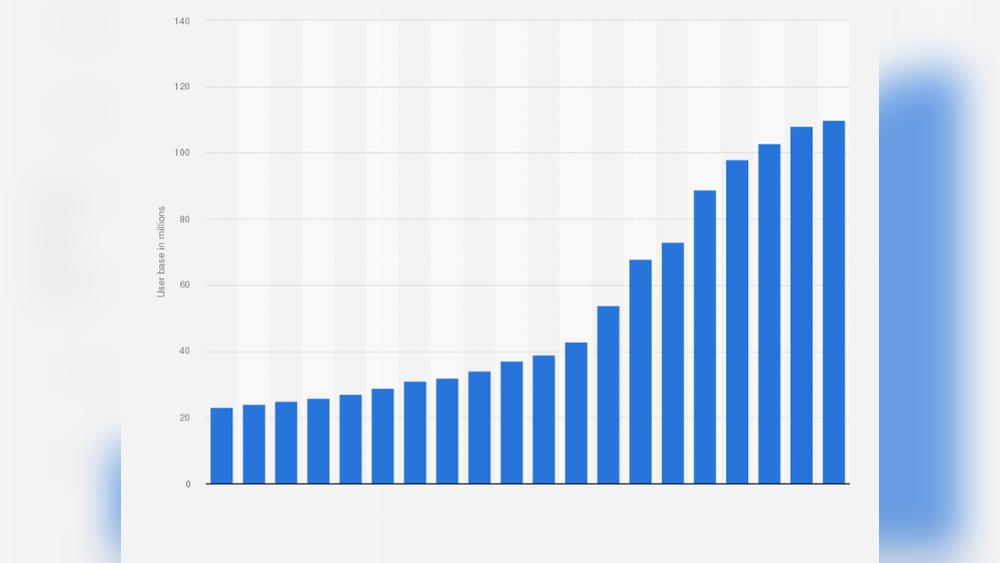
The global SaaS market was valued at over $150 billion in 2023. Analysts predict it will reach $300 billion by 2028. This steady growth reflects strong demand across many sectors. Cloud computing adoption and digital transformation fuel this rise. Small and medium businesses also drive market expansion by using affordable SaaS solutions.
Key Growth Drivers
Remote work trends push companies to adopt cloud tools. SaaS offers flexibility and easy access from anywhere. Lower upfront costs attract startups and small firms. Continuous updates and maintenance by providers reduce IT workload. Integration with other software increases SaaS value. Security improvements build user trust and encourage adoption.
Emerging Markets To Watch
Asia-Pacific shows fast SaaS growth with rising internet use. Countries like India and China have growing tech industries. Latin America also expands SaaS adoption, driven by digital banking and e-commerce. Africa begins to invest in cloud infrastructure for business solutions. These regions offer new opportunities for SaaS providers to expand their reach.
Credit: ascendixtech.com
Customer Acquisition Metrics
Customer acquisition metrics are key to growing any SaaS business. They help track how well a company attracts new users and turns them into paying customers. These numbers show the cost, channels, and success rates involved in gaining customers.
Understanding these metrics allows teams to spend money wisely and improve marketing efforts. It also helps spot areas that need work and boost overall growth. Let’s explore some important customer acquisition metrics.
Average Customer Acquisition Cost
Average Customer Acquisition Cost (CAC) shows how much a company spends to get one new customer. This includes marketing, sales, and other related expenses. A lower CAC means better efficiency and higher profit margins.
For SaaS, the average CAC often ranges between $200 and $1,000. The size and type of the software affect this number. Tracking CAC helps businesses control budgets and avoid overspending.
Effective Acquisition Channels
Some channels bring more customers than others. Popular options include content marketing, paid ads, social media, and email campaigns. Each channel has different costs and conversion rates.
Content marketing often costs less but takes more time. Paid ads give fast results but at a higher cost. Knowing which channels work best allows companies to focus efforts and save money.
Conversion Rate Benchmarks
Conversion rate measures how many visitors become customers. In SaaS, a good conversion rate usually falls between 2% and 5%. Higher rates show strong interest and effective messaging.
Tracking conversion rates helps spot weaknesses in the sales funnel. Improving landing pages, offers, or follow-up emails can increase conversions. Regularly monitoring these rates supports steady growth.
Retention And Churn Rates
Retention and churn rates are key metrics for SaaS companies. They show how many customers stay and how many leave over time. Keeping customers is cheaper than finding new ones. High retention means steady growth and strong customer trust. Low churn means fewer lost customers and better revenue stability.
Industry Average Churn Rates
Most SaaS companies see monthly churn rates between 5% and 7%. Small startups often have higher churn, sometimes over 10%. Larger, established firms usually keep churn below 5%. B2B SaaS products tend to have lower churn than B2C. Understanding these averages helps set realistic goals and measure success.
Strategies To Improve Retention
Good customer support builds loyalty and reduces churn. Regular updates keep the product useful and fresh. Personalizing user experiences increases satisfaction. Offering flexible pricing helps keep different customer types. Asking for feedback shows you care and reveals problems early. These steps encourage customers to stay longer.
Impact Of Churn On Revenue
High churn cuts revenue and growth speed. Losing customers means losing monthly income. Replacing lost customers costs more than keeping them. Reducing churn by just a few percent can boost profits significantly. Stable retention leads to predictable revenue and easier planning. Managing churn is crucial for long-term success.

Credit: www.custify.com
Revenue And Pricing Insights
Revenue and pricing play a big role in SaaS business success. Understanding how companies make money helps predict growth and plan strategies. Pricing models affect customer choices and company profits. Revenue trends show market health and customer behavior. Upselling and cross-selling improve sales without new customers.
Common Pricing Models
SaaS companies use simple pricing models to attract users. The subscription model is most popular. Customers pay a fixed fee monthly or yearly. Some use tiered pricing with different features per level. Usage-based pricing charges by how much customers use the service. Freemium offers free basic service, then charges for extras. Choosing the right model depends on the product and market.
Monthly Recurring Revenue Trends
Monthly Recurring Revenue (MRR) is key for SaaS growth. MRR shows steady income from subscriptions each month. Many SaaS firms aim to increase MRR steadily. Fast-growing companies often report 15% or higher MRR growth monthly. Churn rate impacts MRR by reducing active customers. Tracking MRR helps spot growth or decline early.
Upselling And Cross-selling Statistics
Upselling means selling a better version of a product. Cross-selling means offering related products or services. Both tactics increase revenue without new customers. Studies show upselling can raise revenue by 20% or more. Cross-selling can boost sales by 10% to 30%. Successful SaaS companies train teams to use these strategies well.
User Engagement And Product Usage
User engagement and product usage are key factors in SaaS success. They show how often users interact with the software. High engagement means users find value in the product. Low engagement can signal issues with the user experience or features.
Tracking these metrics helps SaaS companies improve their offerings. It also guides product development and customer support strategies. Understanding how users behave allows businesses to meet their needs better.
Average Daily And Monthly Active Users
Average Daily Active Users (DAU) and Monthly Active Users (MAU) measure user activity. DAU counts unique users each day. MAU counts unique users in a month. High DAU and MAU indicate strong user interest and retention. The ratio of DAU to MAU shows how often users return. A higher ratio means users engage frequently.
Feature Adoption Rates
Feature adoption rates reveal which parts of the product users like. They show how many users try new or key features. Tracking these rates helps identify popular and underused features. Low adoption may mean features are hard to find or use. High adoption highlights features that add real value to users.
Usage Patterns By Customer Segment
Different customer groups use SaaS products in unique ways. Usage patterns vary by industry, company size, and user role. Analyzing these patterns helps tailor the product to specific needs. It also helps target marketing and support efforts effectively. Understanding segments leads to better user satisfaction and growth.
Operational Efficiency Metrics
Operational efficiency metrics help SaaS companies improve daily work. They track key areas that affect service quality and costs. Monitoring these metrics guides teams to work smarter and faster.
These metrics focus on customer support, software development, and spending. Each area tells a story about how well the company performs. Understanding these numbers helps businesses stay competitive.
Customer Support Response Times
Fast response times improve customer happiness. Many SaaS companies aim to answer support tickets within an hour. Quick replies reduce frustration and keep users loyal. Tracking average response time shows how well support teams perform.
Slow responses can cause users to leave. Therefore, companies use tools to measure and shorten these times. Clear goals help support staff work efficiently.
Development And Deployment Frequencies
How often software updates launch matters a lot. Frequent deployments mean bugs get fixed fast. New features reach users quickly. This keeps the product fresh and competitive.
Teams track the number of releases each week or month. High frequency shows active development and good process flow. Low frequency may signal delays or technical issues.
Cost Optimization Benchmarks
Keeping costs low is crucial for SaaS success. Companies compare spending on cloud services, tools, and staff. They seek ways to reduce waste without hurting quality.
Benchmarks help identify overspending areas. Efficient cost management ensures long-term growth. Regular reviews of expenses keep budgets on track.
Future Saas Industry Predictions
The future of the SaaS industry looks bright and full of change. New technologies and customer needs will shape how SaaS businesses grow. Many trends will affect the market and create new chances for companies. Understanding these predictions helps businesses stay ready and competitive.
Technological Innovations Impact
Artificial intelligence will play a bigger role in SaaS products. Automation will make software easier and faster to use. Cloud computing will grow, offering more power and flexibility. Security technologies will improve to protect data better. These innovations will help SaaS companies offer smarter and safer tools.
Shifts In Customer Expectations
Customers want software that is simple and fast. They expect constant updates and new features. Personalization will become important in SaaS solutions. Users will demand better support and easy access from any device. Meeting these expectations will be key to keeping customers happy.
Growth Opportunities Ahead
The SaaS market will expand in small and medium businesses. Vertical SaaS, targeting specific industries, will rise. Global demand for cloud software will increase. More companies will adopt subscription models. These factors will create many chances for new and existing SaaS providers.
Frequently Asked Questions
What Is The Current Growth Rate Of The Saas Industry?
The SaaS industry grows at an annual rate of about 18-22%. This rapid growth is driven by cloud adoption and remote work trends. Businesses prefer SaaS for scalability and cost-efficiency. The demand for SaaS solutions is expected to rise consistently in the coming years.
How Much Revenue Does The Saas Market Generate Annually?
The global SaaS market generates over $150 billion in annual revenue. This figure reflects widespread adoption across industries. Continuous innovation and digital transformation fuel this revenue growth. SaaS remains a dominant model in enterprise software spending.
What Percentage Of Businesses Use Saas Products Today?
Over 80% of businesses worldwide use at least one SaaS product. SaaS solutions simplify IT management and reduce upfront costs. They are popular among startups and large enterprises alike. This high adoption rate shows SaaS’s significant role in business operations.
Which Sectors Lead Saas Adoption Globally?
Technology, healthcare, and financial services lead SaaS adoption globally. These sectors benefit from SaaS’s flexibility and security features. SaaS tools enhance collaboration, data management, and customer experience in these industries. Their early adoption often sets trends for other sectors.
Conclusion
SaaS continues to grow fast every year. More businesses choose cloud software for ease and cost savings. Users like quick updates and flexible plans. Data shows strong demand across many industries. This trend likely keeps rising with tech advances. Understanding these stats helps companies make smart choices.
Staying aware of market changes is key. SaaS shapes how people work and connect today. Keep watching the numbers for future insights.