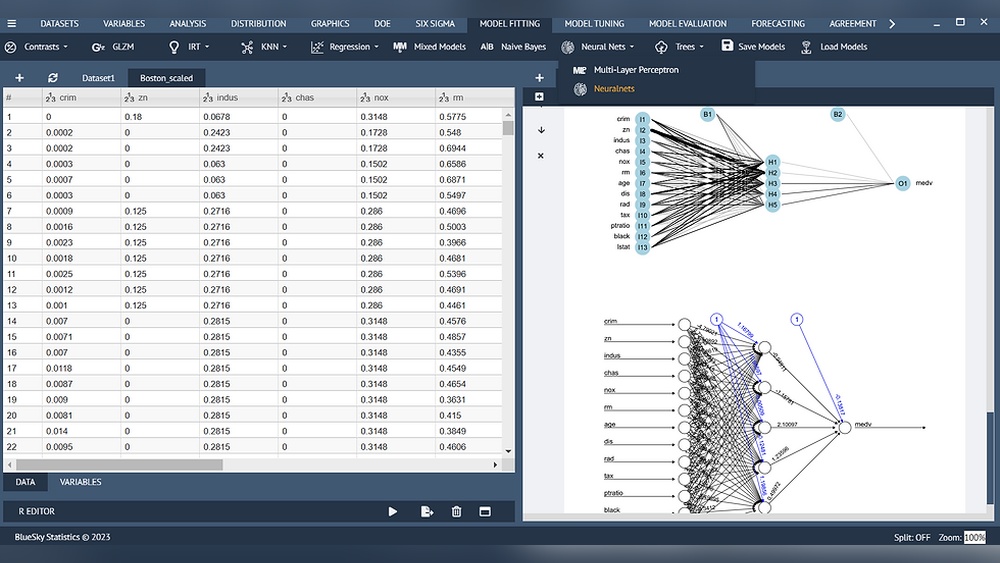
If you want to make smarter decisions with your data, Bluesky Statistics could be the tool you’ve been searching for. Imagine having a powerful, easy-to-use program that helps you analyze numbers quickly and clearly—without needing to be a statistics expert.
Whether you’re a student, researcher, or business professional, understanding how Bluesky Statistics works can save you time and boost your confidence in handling data. Keep reading to discover how this software can transform the way you approach statistics and make your projects easier than ever.

Credit: www.blueskystatistics.com
Bluesky Statistics Basics
Bluesky Statistics is a user-friendly software designed for data analysis and statistics. It helps users perform complex statistical tasks without deep coding skills. The software combines powerful features with a simple design. This makes it ideal for beginners and professionals alike.
Understanding the basics of Bluesky Statistics is important. It allows users to navigate the tool easily and use its functions effectively. The following sections explain the key features, user interface, and supported data formats.
Key Features
Bluesky Statistics offers many useful features. It supports various statistical tests like t-tests, ANOVA, and regression. The software also provides clear visual reports and charts. Users can run analyses quickly using menus instead of code. It supports data cleaning and transformation tools. These features help users prepare data for analysis with ease.
User Interface Overview
The user interface is simple and clear. Menus and buttons are easy to find and use. Most actions happen through point-and-click options. Results appear in a separate output window. This window shows tables and graphs neatly. The interface also allows users to save and export reports. Simple design helps users focus on data, not on complicated controls.
Supported Data Formats
Bluesky Statistics works with many data formats. It can open files like CSV, Excel, and SPSS. Users can import data from databases too. This flexibility helps users work with data from different sources. Data can be exported after analysis in common formats. This makes sharing and further work simple.
Data Import And Preparation
Data import and preparation form the foundation of any analysis in Bluesky Statistics. These steps help organize data for clear insights. Proper import and cleaning reduce errors and improve results.
Bluesky Statistics offers simple tools to bring data from various sources. Users can prepare data quickly without coding skills. The software supports common file types and database connections.
Connecting Data Sources
Bluesky Statistics connects easily to spreadsheets, databases, and text files. Users select the source and import data in a few clicks. The software supports Excel, CSV, and SQL databases.
It also allows direct import from online sources. This speeds up data access and keeps information up to date.
Cleaning And Transforming Data
Data often contains errors or is in the wrong format. Bluesky Statistics provides tools to fix these issues. Users can change data types and remove duplicates fast.
The software also helps create new variables from existing ones. This supports better analysis and clearer results.
Handling Missing Values
Missing values can affect analysis quality. Bluesky Statistics shows where data is missing. Users can choose to fill gaps or remove incomplete records.
The software offers several options like mean substitution or deletion. This flexibility helps maintain data accuracy for better conclusions.
Core Statistical Tools
Bluesky Statistics offers a set of core tools for basic data analysis. These tools help you understand your data better. They cover key areas of statistics used in many fields. Each tool is designed to be easy to use and clear.
With these core tools, you can describe data, test ideas, and explore relationships. The software guides you through the process step by step. This makes it perfect for beginners and those learning statistics.
Descriptive Statistics
Descriptive statistics summarize data in simple ways. You get measures like mean, median, and mode. These numbers show the center and spread of your data. You also get charts like histograms and box plots. These visuals make understanding data faster and clearer.
Hypothesis Testing
Hypothesis testing checks if a claim about data is true. Bluesky Statistics supports common tests like t-tests and chi-square tests. These tests compare groups or check for patterns. The software explains results in simple terms. It helps you decide if your data supports your idea.
Regression Analysis
Regression analysis finds links between variables. It shows how one factor affects another. Bluesky Statistics offers linear and multiple regression options. You can predict outcomes based on input data. This tool helps find trends and make decisions.
Advanced Analytics Techniques
Bluesky Statistics offers advanced analytics techniques to explore data deeply. These methods help uncover patterns and relationships. They make analysis clear and actionable.
Each technique targets different data types and questions. Users can handle complex data with simple steps. This section highlights three key techniques in Bluesky Statistics.
Time Series Analysis
Time series analysis studies data points over time. Bluesky Statistics helps detect trends and seasonal patterns. It supports forecasting future values easily. This method suits sales, weather, and stock data. Users can visualize changes and make predictions fast.
Multivariate Analysis
Multivariate analysis examines multiple variables at once. Bluesky Statistics shows how variables relate and influence each other. It includes techniques like factor analysis and cluster analysis. This helps understand complex data structures. Users find hidden groups and key drivers in data.
Machine Learning Integration
Bluesky Statistics supports machine learning models. Users can run classification, regression, and clustering algorithms. It offers clear results without coding skills. Machine learning helps identify patterns beyond simple analysis. This makes data-driven decisions smarter and faster.
Visualization Options
Bluesky Statistics offers a variety of visualization options to help you understand data better. Visuals turn numbers into clear images. These images make it easier to spot trends and patterns quickly. The tool provides simple ways to create and adjust charts and graphs. You can also build interactive dashboards to explore your data deeply.
Creating Charts And Graphs
Bluesky Statistics lets you create many types of charts. Bar charts, line graphs, pie charts, and scatter plots are all available. The process is simple and user-friendly. Just select your data and pick the chart type. The software generates the chart automatically. This helps you see your data clearly and fast.
Customizing Visuals
Each chart or graph can be customized to fit your needs. Change colors, labels, and fonts easily. You can adjust the size and style of your visuals. This makes your data presentation unique and clear. Customization helps highlight important information in your charts.
Interactive Dashboards
Bluesky Statistics supports interactive dashboards for better data exploration. You can add multiple charts and controls in one view. Users can filter and adjust data on the fly. This interaction helps find specific insights quickly. Dashboards keep all relevant visuals in one place for easy access.
Collaborating And Sharing Results
Sharing and working on data together helps teams make better decisions. Bluesky Statistics offers tools that make sharing results simple and clear. Teams can export reports, work together smoothly, and use cloud services. These features help keep everyone updated and involved.
Exporting Reports
Bluesky Statistics lets users export reports in many formats. You can save files as PDF, Word, or Excel. These formats are easy to share by email or on websites. Exporting keeps your data clear and easy to read. This helps others understand your findings quickly.
Team Collaboration Features
Teams can work on projects inside Bluesky Statistics. The software allows multiple users to access and edit reports. Comments and notes can be added to explain results. This makes teamwork smooth and reduces mistakes. Everyone stays on the same page during analysis.
Cloud Integration
Bluesky Statistics connects with popular cloud storage services. Users can save and open files from Google Drive or Dropbox. This keeps data safe and easy to reach anywhere. Cloud integration helps teams share results without delays. It also supports remote work and quick updates.
Tips For Maximizing Insights
Bluesky Statistics is a powerful tool for data analysis. It helps you find patterns and answers quickly. To get the most from Bluesky, follow some simple tips. These tips make your work easier and your results clearer.
Best Practices
Start with clean data. Check for missing or wrong values. Use clear labels for your variables. Organize your data before analysis. Choose the right test for your question. Run small tests first. Save your work often. Take notes on your steps. These habits keep your work smooth.
Common Pitfalls To Avoid
Do not ignore data errors. Avoid rushing through analysis. Skipping data checks leads to wrong answers. Don’t use complex methods without understanding them. Avoid mixing different data types carelessly. Do not ignore outliers without reason. Avoid saving over your original files. These mistakes waste time and cause confusion.
Leveraging Community Resources
Use forums and user groups for help. Many users share tips and solutions. Check official guides and tutorials often. Join discussions to learn new tricks. Ask clear questions for faster answers. Share your experiences to help others. These resources boost your skills and confidence.

Credit: www.softwareadvice.ie

Credit: www.softwareadvice.ie
Frequently Asked Questions
What Are Bluesky Statistics In Social Media?
Bluesky statistics track user engagement, growth, and activity on the Bluesky platform. They help analyze trends and user behavior. Marketers use these stats to optimize content and improve reach. These insights guide effective social media strategies on Bluesky.
How To Access Bluesky User Statistics?
You can access Bluesky statistics via built-in analytics tools or third-party apps. These tools provide data on followers, posts, and interactions. Simply log into your account and navigate to the analytics section. Regularly reviewing stats helps improve your content strategy.
Why Are Bluesky Statistics Important For Marketers?
Bluesky statistics reveal audience preferences and engagement patterns. Marketers use these insights to tailor content and boost visibility. Accurate data helps in measuring campaign success and ROI. It also supports better targeting and growth on Bluesky.
How Often Should You Check Bluesky Statistics?
Check Bluesky statistics weekly or biweekly for timely insights. Frequent reviews help you spot trends and adjust strategies quickly. Consistent monitoring improves content performance and follower engagement. Avoid overwhelming data by setting a regular schedule.
Conclusion
Bluesky statistics offer useful insights into social media trends. They help understand user behavior and platform growth. Tracking these numbers guides better decisions for content creators. Data shows how people interact and what they prefer. Staying updated with Bluesky stats keeps you informed and ready.
The platform’s changes reflect in these important numbers. Watching these trends can improve your online presence. Simple, clear stats make complex data easy to grasp. Use this information to connect better with your audience. Bluesky statistics matter for anyone interested in social media.