

What is the average Conversion Rate for Google Ads ? When it comes to digital marketing, there’s one question every business owner asks sooner or later:
“Are these campaigns actually paying off?”
Clicks look good in a report. Impressions might boost visibility. But none of that matters unless ads generate leads, calls, bookings, or sales. That’s where conversion rate takes the spotlight.
At Hive Creatives, we’ve worked with more than a hundred Google Ads accounts over the last five years. Because we’re fixated on results, we track conversion performance closely across industries.
This post shares what we’ve learned from 121 client accounts between 2018 and 2023. That pool includes:
- 76 B2B companies
- 24 B2C companies
- 21 companies with mixed models
From that data, we’ve built a clear picture of what “average” looks like in Google Ads—and why the word “average” often hides more than it reveals.
What Counts as a Conversion?
Before diving into numbers, let’s define terms.
Google measures conversion rate as:
Conversions ÷ Total ad interactions
In practice, this means the percentage of people who click your ad and then complete a specific action—submitting a form, making a call, scheduling a consultation, or buying something.
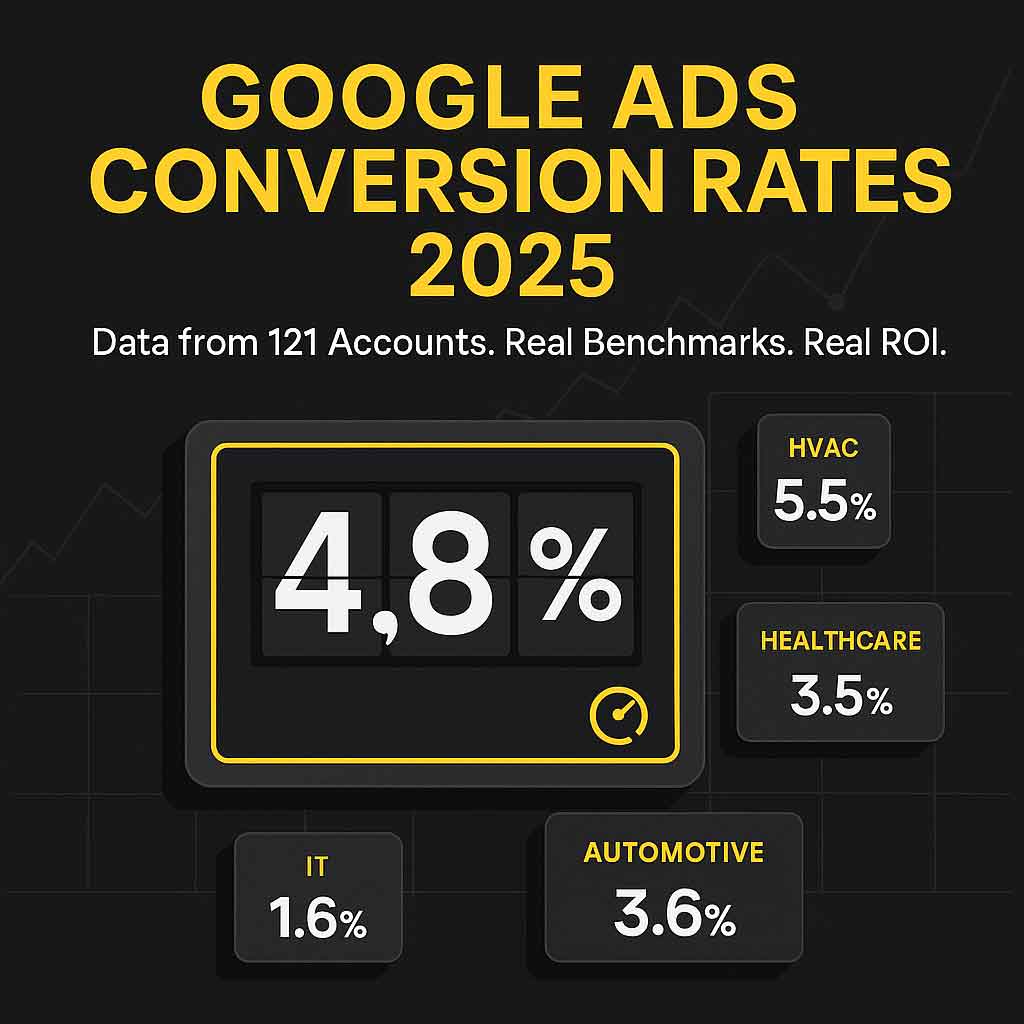
The Big Picture: 4.8%
Across all industries, the average conversion rate came out at 4.8%.
That sounds like a strong benchmark. If your campaigns convert above 5%, you might assume you’re ahead of the curve. But averages flatten real variation. A “good” rate depends entirely on your market. In some industries, 2% is exceptional. In others, 5% would be considered weak.
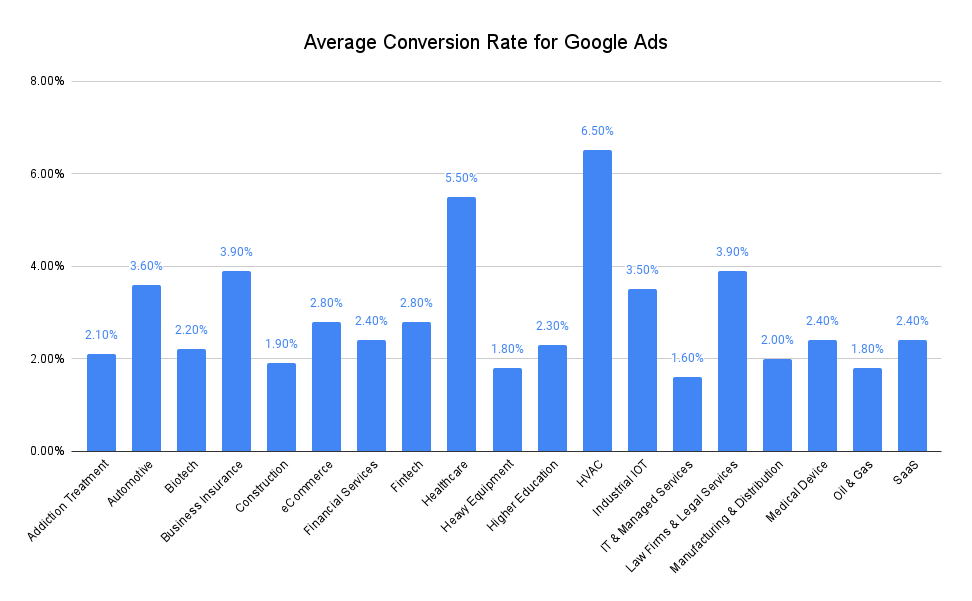
Industry-Specific Averages
Here’s how conversion rates look when broken down by sector:
| Industry | Avg. Conversion Rate |
|---|---|
| Addiction Treatment | 2.1% |
| Automotive | 3.6% |
| Biotech | 2.2% |
| Business Insurance | 3.9% |
| Construction | 1.9% |
| eCommerce | 2.8% |
| Financial Services | 2.4% |
| Fintech | 2.8% |
| Healthcare | 5.5% |
| Heavy Equipment | 1.8% |
| Higher Education | 2.3% |
| HVAC | 6.5% |
| Industrial IoT | 3.5% |
| IT & Managed Services | 1.6% |
| Legal Services | 3.9% |
| Manufacturing & Distribution | 2.0% |
| Medical Devices | 2.4% |
| Oil & Gas | 1.8% |
| SaaS | 2.4% |
Why Rates Vary So Much
Customer intent. Some markets involve urgent needs. If your furnace breaks in winter, you’re not browsing casually—you’re calling an HVAC provider right away. That urgency explains HVAC’s top conversion rate of 6.5%. Contrast that with IT services, where purchase cycles stretch across months and involve multiple decision-makers. Average rate there: just 1.6%.
Offer quality and funnel design. Even within a single industry, performance shifts depending on how strong the offer is. Clear value propositions, frictionless landing pages, persuasive copy, accurate targeting, and solid follow-up systems can double or triple conversion rates compared to weak setups.
What the Numbers Mean for You
Industry averages give useful reference points, but they’re not the finish line.
If your law firm sits at 3.9%, you’re keeping pace. But with better funnels and sharper creative, you could reach 6% or more. If your eCommerce campaigns hit 2.8%, you’re on par. Yet top performers in that space push far beyond 5%.
The real challenge isn’t to match the average. It’s to define your own baseline, then engineer systems that keep raising it.
Benchmarks as a Starting Line
At Hive Creatives, we focus less on “normal” numbers and more on what’s possible.
A few examples from recent work:
- A healthcare provider lifted their conversion rate from 3% to 7.5% with a landing page redesign and new ad messaging.
- A SaaS company jumped from 2% to 5.2% after we added retargeting and refined their signup process.
- An HVAC client already above industry average at 6.5% scaled past 8% with new creative and tighter audience targeting.
These jumps didn’t come from magic tricks. They came from structured testing, disciplined tracking, and relentless optimization.
What to Aim for in 2025
Here’s how we frame it with our clients:
- Below average? Fix the basics. Clarify the offer, upgrade the landing page, and refine targeting.
- At average? Great. You’re competitive. Now install systems to push past “good enough.”
- Above average? Keep testing. Even small gains compound into major ROI.
The Takeaway
The cross-industry average conversion rate for Google Ads is 4.8%. But averages are only the middle of the pack.
The better question isn’t How do I compare to the average? It’s How much return can I extract from every single click?
That shift separates businesses that treat ads as a cost from those that use ads as a growth engine.
At Hive Creatives, our focus is simple: every marketing dollar should multiply.